 |
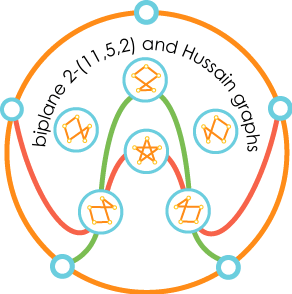
This is a generator-only picture of the biplane with parameters 2-(11,5,2). This geometry has 11 points and 11 lines with 5 points on every line and 5 lines passing through every point. Furthermore, 2 distinct points are contained in exactly two distinct lines and 2 distinct lines intersect in exactly two distinct points. The 11 blue labels correspond to the 11 points of the biplane. The lines are "generated" by the three distinguished lines (orange, red and green) by rotating the diagram around its center 72 degrees at a time. |